Power and Indicator Diagrams
Locomotive Power and Indicator Diagrams
Power is defined as “the rate of doing work”. Common units of power in the metric system are Watts (W), kilowatts (kW), Megawatts (MW) and Gigawatts (GW), where 1 Watt = 1 Joule per second = 1 Newton-metre per second. Alternative units of measurement are calories per second and kilo-calories per hour (1 kW = 860 kcal/hr) Common imperial units of power are: Btu per second (1 Btu/s = 1.06 kW) and the Horsepower where 1 (British) hp = 0.746 kW.
Power can also be defined as the multiple of force and speed, from which it can be deduced that a locomotive’s power and tractive effort (TE) are intrinsically related: Power = TE x speed.
Livio Dante Porta liked to define a locomotive’s power in the following thermodynamic terms, as can be found in his papers on “Fundamental Principles of Steam Locomotive Modernization and Their Application to Museum and Tourist Railways” and “Fundamentals of the Porta Compound System for Steam Locomotives“:
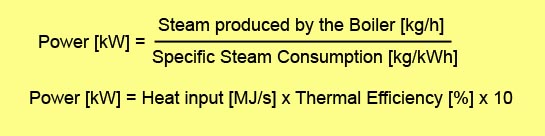
In reference to the first equation, Porta writes:
“Thus the power is limited by [the amount of steam supplied by] the boiler, while the function of the cylinders is to extract the maximum work from the steam supplied”,
“The second equation shows that the [power] limit is determined by the ability of the boiler to burn as much fuel per hour as possible, but the resulting power is determined by the thermal efficiency.”
A common point of confusion in locomotive terminology is the difference between indicated power and drawbar power, the basic difference being that “indicated power” is the power developed in the cylinders, whereas “drawbar power” is the power delivered at the drawbar.
Indicated Power
The word “indicated” comes from the use of “Indicator Diagrams” that before the electronic era were mechanically plotted to indicate the variation in steam pressure inside a cylinder against the swept volume over the length of the piston stroke, separate diagrams usually being plotted on the same sheet of paper for both ends of the cylinder. The cylinder’s power output is calculated from the area contained within the plotted curve. It may be noted that a locomotive’s power output can be increased by increasing the area contained inside the Indicator Diagram.
An example of a typical Indicator Diagram is shown below which also illustrates the four phases of the cylinder cycle:
-
Admission which occurs from the moment that the steam inlet port opens (near the beginning of the piston stroke) until the moment of “cut off” when it closes. At the beginning of the piston stroke, the cylinder pressure is (or should be) the same as the steam chest pressure. As the piston moves, some reduction of pressure may occur if the steam chest and/or the ports are too small.
-
Expansion which occurs from the moment of “cut off” until the exhaust port opens (near the end of the piston stroke). During this time, the steam in the cylinder expands adiabatically (meaning no heat input) resulting in the reduction of its pressure. The relationship between pressure and swept volume can usually be estimated using the equation PVn=K, where P is the steam pressure; V is the cylinder volume (including clearance volume); n is a constant, normally assumed to be 1.3 and K is a constant.
-
Exhaust which occurs on the return stroke between the moment the exhaust port opens until it closes again. During the exhaust phase, the cylinder pressure – or “back pressure” – is relatively constant, being governed by the steam flow through the exhaust ports and blast pipe. It can be readily seen that the area within the diagram can be dramatically increased by reducing the back pressure during the exhaust phase. This is the reason why simple modifications such as the fitting of double chimneys or Kylpor exhaust systems, result in immediate and dramatic improvement in locomotive performance.
-
Compression which occurs between the moment that the exhaust port closes until the inlet port opens. It is clear that the area within the Indicator Diagram can be maximised by making the exhaust phase as long as possible and the compression phase as short as possible. Some compression may nevertheless be desirable, as in the case of the 5AT where it provides “cushioning” for the pistons, counteracting the inertial forces that occur at the ends of each stroke and which would otherwise cause crank-pin overstress at very high speeds.

The shape of the indicator diagram and losses that are represented by it, are discussed on several separate pages including:
- Clearance Volume
- Wall Effects and Condensation
- Triangular Losses
- Incomplete Expansion
- Steam Tightness
Drawbar Power: The power output at the drawbar of a locomotive, the drawbar being the coupling between the locomotive and the train that it is hauling.
Drawbar power used to be measured by attaching a “dynamometer car” between the locomotive and its train. A dynamometer car incorporates a number of measuring devices including a calibrated spring for measuring the tractive force from the locomotive and a odometer wheel for accurately measurement of distance covered, and a timing device from which speeds can be calculated. In addition, the dynamometer car would house mechanical plotting devices and a team of people to monitor them. Nowadays an electronic load-cell can be fitted between the locomotive and its train and GPS used for measuring speed and distance, with data being logged and power outputs calculated on a laptop computer.
Drawbar power is the Indicated Power minus the mechanical losses in the locomotive’s motion and the rolling losses (including the wind losses) of the locomotive and its tender. In the case of the 5AT, its drawbar power is diminished by the fitting of a large (80 tonne) tender. Because the rolling losses (and especially the wind losses) increase with speed, a locomotive’s drawbar power tends to peak at a lower speed than the Indicated Power.
Equivalent Drawbar Power: Equivalent drawbar power = drawbar power at constant speed on level tangent track. It eliminates the factors of acceleration and gradient/curvature resistance on the locomotive itself, the power to overcome which would be available at the drawbar at constant speed on level tangent track.
“Equivalent drawbar power vs. speed curves for various locomotives are shown below, copied from page 499 of David Wardale’s “The Red Devil and Other Tales from the Age of Steam” with the Tractive Effort curves removed for clarity.
[Note: The same diagram showing Tractive Effort vs. Speed can be viewed on the Tractive Effort page of this website.] [It is interesting to note that the Standard “Britannia” Class 7 produced a slightly higher power output than the Rebuilt “Merchant Navy” Pacific.]