There are six interrelated properties that define the state of steam:
- Temperature
- Pressure
- Dryness Fraction (within the saturated zone)
- Enthalpy
- Internal energy
- Entropy
Fixing the value of any two properties defines the value of all the others. Thus fixing the values of Enthalpy and Entropy is sufficient to define Temperature, Pressure and Internal Energy of the steam.
The term “Mollier diagram” (named after Richard Mollier, 1863-1935) refers to any diagram that features Enthalpy on one of the coordinates. Commonly used Mollier diagrams are the enthalpy-entropy (or h-s) diagram (below) and the pressure-enthalpy diagram illustrated at the bottom of this page.
The Enthapy-Entropy or h-s diagram:
The h-s diagram is one in which Enthalpy values form the vertical axis and Entropy the horizontal axis. The values of the other related properties may be superimposed in the form of supplementary curves.
In the diagram below:
- green lines show steam temperature;
- blue lines give (absolute) steam pressure; and
- red lines give the dryness fraction (in the saturated zone).
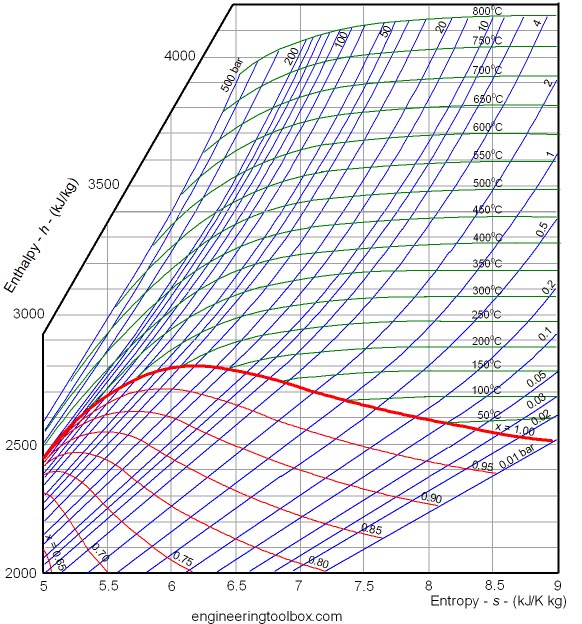
Ideal (isentropic) expansion is represented on the Mollier diagram by a vertical line. Actual expansion of steam always involves some losses represented by an increase in entropy.
In the 5AT FDCs, Wardale gives examples of this, for instance in lines 68 to 84 of FDC 1.3 where he calculates the isentropic efficiency of the 5AT at maximum drawbar power. Here he assumes that the steam enters the cylinders at an absolute pressure of 21.39 bar and temperature of 450oC shown as point A in the diagram below.
He then assumes that the steam will exhaust at an absolute pressure of 1.5 bar. Thus an isentropic expansion line AB can be drawn vertically at a constant entropy of 7.254 kJ/K kg, with point B being defined by pressure = 1.5 bar.
However in FDC 1.3 line 78 Wardale calculates that the actual exhaust steam enthalpy = 2,803 kJ/kg which allows point C to be located on the 1.5 bar pressure line. Thus the actual steam expansion is defined by the line AC.
The slope of the line AC is indicative of the isentropic efficiency of the expansion: the nearer the line is to vertical, the higher isentropic efficiency. Actual isentropic efficiency is determined by dividing the specific work done in the cylinder (FDC 1.3 line 82) by the isentropic heat drop between admission and exhaust (FDC 1.3 line 83).

Porta used similar lines in his Compounding paper but has simplified them by omitting all the irrelevant lines from his diagrams.
The Pressure-Enthalpy diagram below is an alternative representation of the Steam Tables, where the axes are Pressure (Vertical) and Enthalpy (Horizonatl) and with curves representing temperature (T), entropy (s), specific volume (v), and dryness fraction (x).
The dome-shaped curve represents the limits of saturation – within the dome, steam is saturated.
Note: The same points A, B and C from the diagram above are illustrated in red. In this case the line of constant pressure (BC) is straight and the line of constant entropy (AB) is curved.
